Entry In The Zone & SMC Multi Timeframe
Have you ever been like this? Staying up late drawing market structure by hand, only to look up and see the price has already run past the point you planned. Or opening four or five timeframes at once until you're confused about which chart you're even looking at. Or just entering on a signal, only for the price to sweep liquidity and reverse immediately. This is a problem every Smart Money Concepts trader has faced to some degree — not because you're not skilled enough, but because the manual work required is simply too much to keep up with the real speed of the market. This manual will walk you through everything from the basic concepts to how to let this tool take over the most time-consuming tasks, so that all that's left for you to do is make the decisions that truly matter.
Table of Contents and Learning Path
This manual progresses from basic understanding to setup and practical use. We recommend reading it in order the first time. If you want to find how to set up something specific, you can jump directly to a topic from the table of contents.
The first part explains what SMC is and what the tool can help with. Then it introduces the dashboard and settings, before ending with the chart analysis workflow, risk management, and bonus tools.
Part 1 · Understand Before Using
1. SMC and Core Features
Understand Market Structure, Liquidity, POI, and the tool's role
Part 2 · Get to Know the Tool
2–8. Dashboard and Settings
Learn about Multi-Timeframe mode, alerts, display, versions, and the Risk Calculator
Part 3 · Real Use
9–11. Plan and Maintain Usage
Follow the SMC analysis steps, learn about the bonus tools, and see how to install or update
| Topic | What you'll learn | Go to topic |
|---|---|---|
| 1. Understand Before Using | Smart Money Concepts (SMC) and the tool's core features | Start reading · Core features |
| 2. Dashboard Overview | Major/Minor Trend, Mitigated Zone, and display options | Open topic |
| 3. Single vs Multi Timeframe | The difference and choosing the right mode for your analysis | Open topic |
| 4. Alerts | Alert Signal, Mitigation Zone, and Market Structure Change | Open topic |
| 5. Customize Display | Themes, display, and panel management | Open topic |
| 6. Swing ZigZag | Settings and things to know about Swing ZigZag | Open topic |
| 7. Choose Version | Comparing the Indicator Version and Utility Version | Open topic |
| 8. Risk Per Trade Calculator | Using the risk calculator tool in the Utility Version | Open topic |
| 9. SMC Workflow | The analysis sequence from trend to risk management | Open topic |
| 10. FABLE Pro Suite | Details of all 7 free bonus indicators | Open topic |
| 11. Purchase, Install, and Update | Steps for using the product via the MetaTrader Market | Open topic |
What Is Smart Money Concepts (SMC)?
Core concept: SMC is a Price Action analysis method that focuses on understanding how large players or institutions drive the market, rather than relying solely on traditional indicators. SMC analyzes the market through Market Structure, Liquidity, and Points of Interest to find high-probability trading opportunities.
Core components: Market Structure (BOS and CHoCH), Liquidity, Order Blocks, Supply & Demand zones, Fair Value Gaps (FVG), and Premium & Discount zones. These concepts help you understand not just where the price is going, but why it's going there.
The problem with doing it manually: Manual SMC analysis — drawing structure, marking Order Blocks, finding liquidity, and switching between multiple timeframes — takes a lot of time. This is why Entry In The Zone & SMC Multi Timeframe was developed: to shorten this entire analysis process.
Core Features of the Tool
Now that you understand the SMC concept, this section explains what information the tool displays. Details on how to read the dashboard and settings are covered in the next topic.
Automatic Structure Detection
The system detects BOS, CHoCH, mBOS, and mCHoCH, with a clear separation of Major Trend and Minor Trend. It automatically detects Swing High/Low and HH/HL/LH/LL labels, and supports both single-timeframe and multi-timeframe analysis.
Strong & Weak High/Low — Automatically separates the most significant swing points from minor swings
Automatic Key Points of Interest
Detects Order Blocks, Supply & Demand Zones, and FVG in real time according to SMC principles. Zones are drawn automatically every time.
All Market Data in One Tool
Liquidity Sweep Detection, Liquidity, Equal High/Low, PDH/PDL, PWH/PWL, Premium/Discount, Auto Fibonacci, and Trading Sessions — all in one window
Real-Time BUY / SELL Signals and Alerts
No-Repaint Logic: The system displays BUY / SELL signals with real-time alerts whenever a trading signal occurs or the market structure changes, such as BOS / CHoCH, as well as reversal signals in key zones.
The BUY / SELL signal system is designed to help reduce false signals and help users better assess trading opportunities.
Dashboard Overview
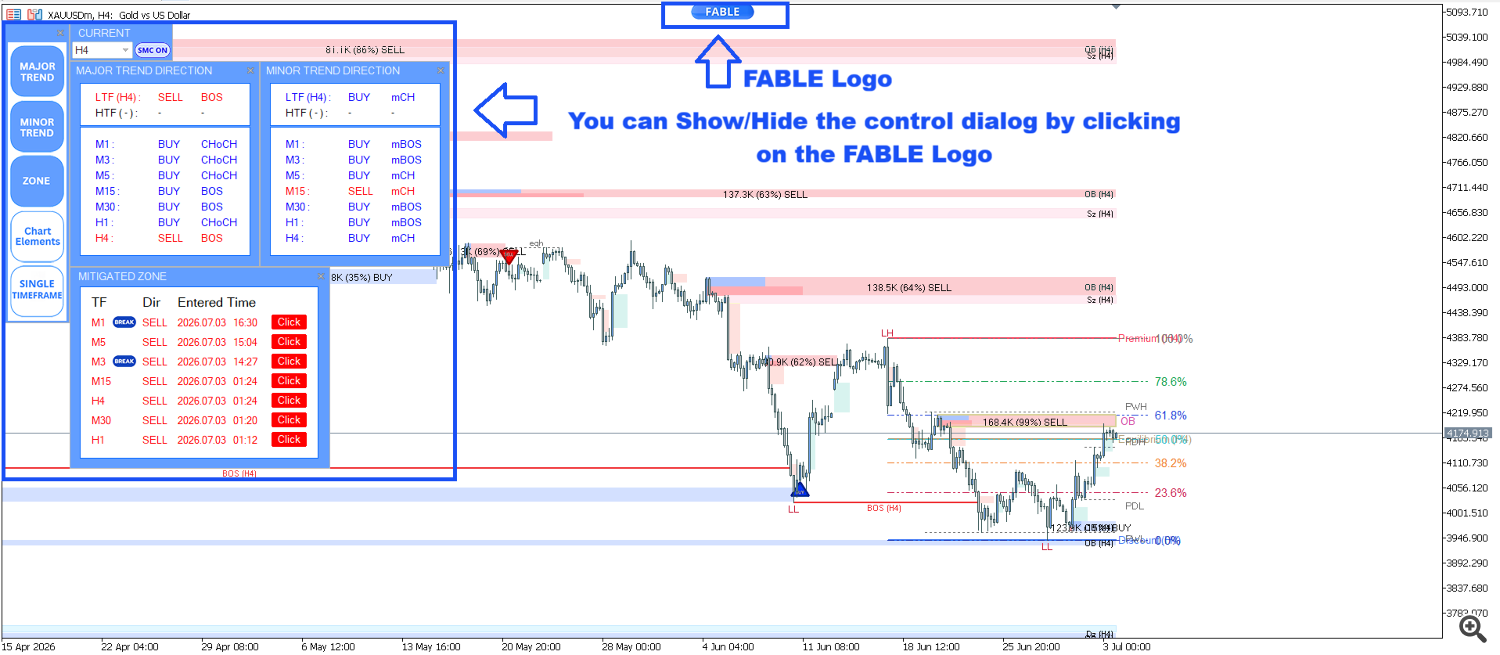
The dashboard brings together key information from your selected timeframe, so you can check market direction and important zones more conveniently. You can turn chart elements on or off according to your own analysis style, keeping the screen clean and showing only the information you need.
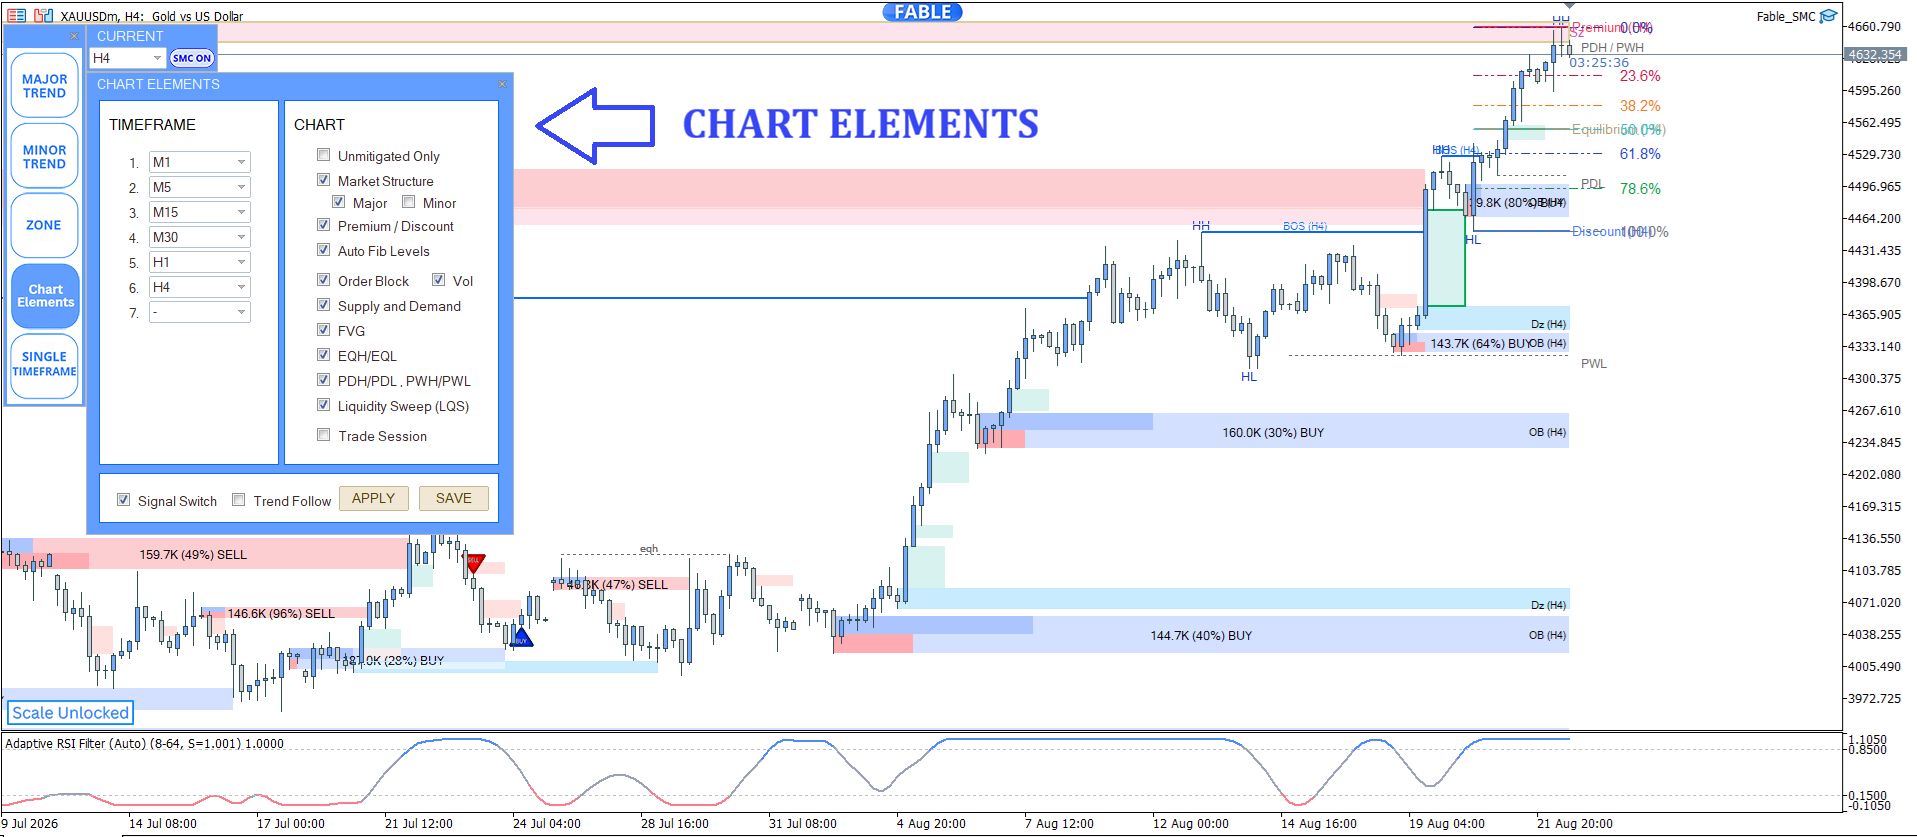
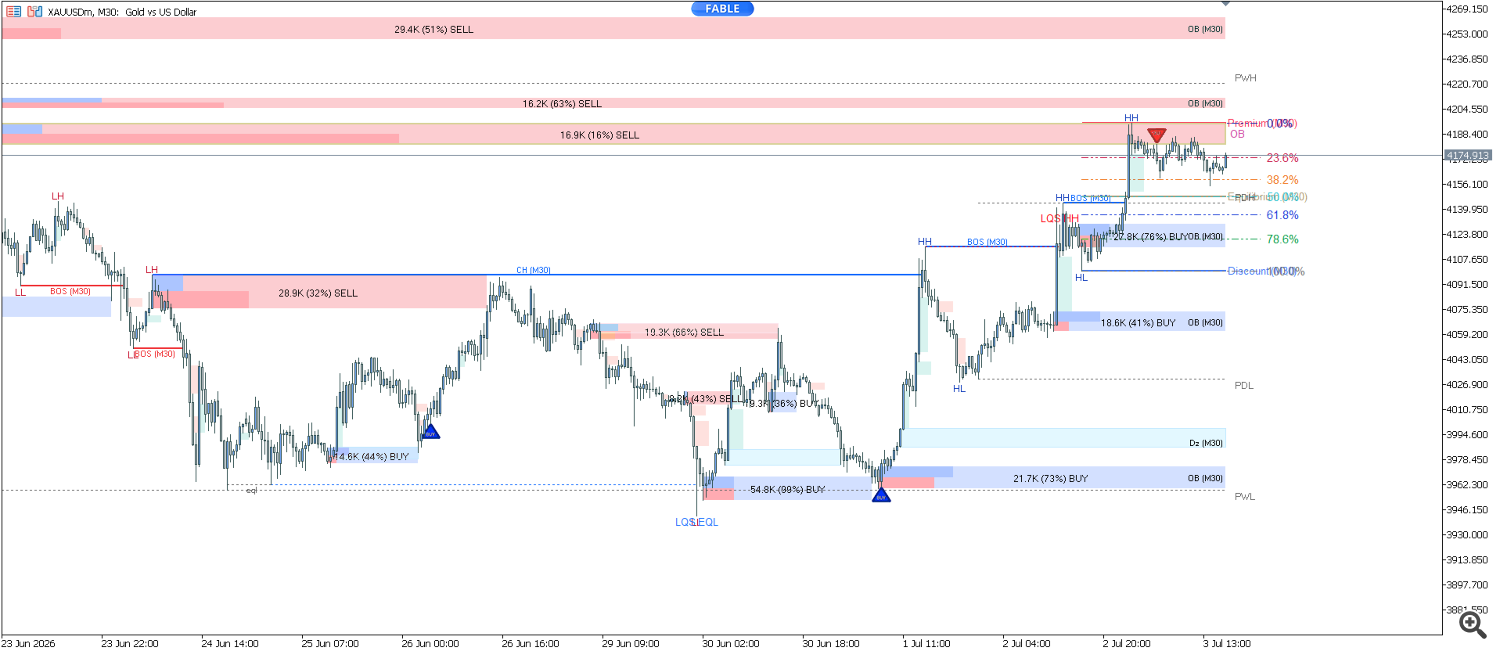
Example of SMC elements that can be turned on or off on the chart
Major Trend Direction
Shows the main trend structure direction of the selected timeframe, to help assess the overall market picture
Minor Trend Direction
Shows the minor trend structure direction, helping track short-term changes within the main market picture
Mitigated Zone
Shows a list of zones that have been tested or used, ordered from most recent to oldest, and can be clicked to switch between viewing data for each timeframe
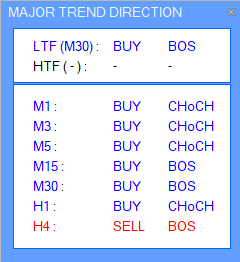
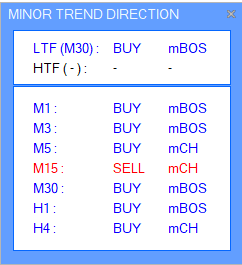
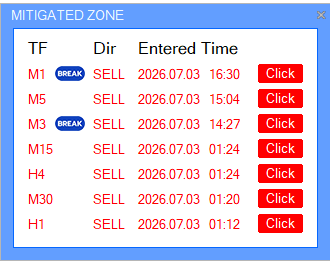
Main dashboard windows: Major Trend Direction, Minor Trend Direction, and Mitigated Zone
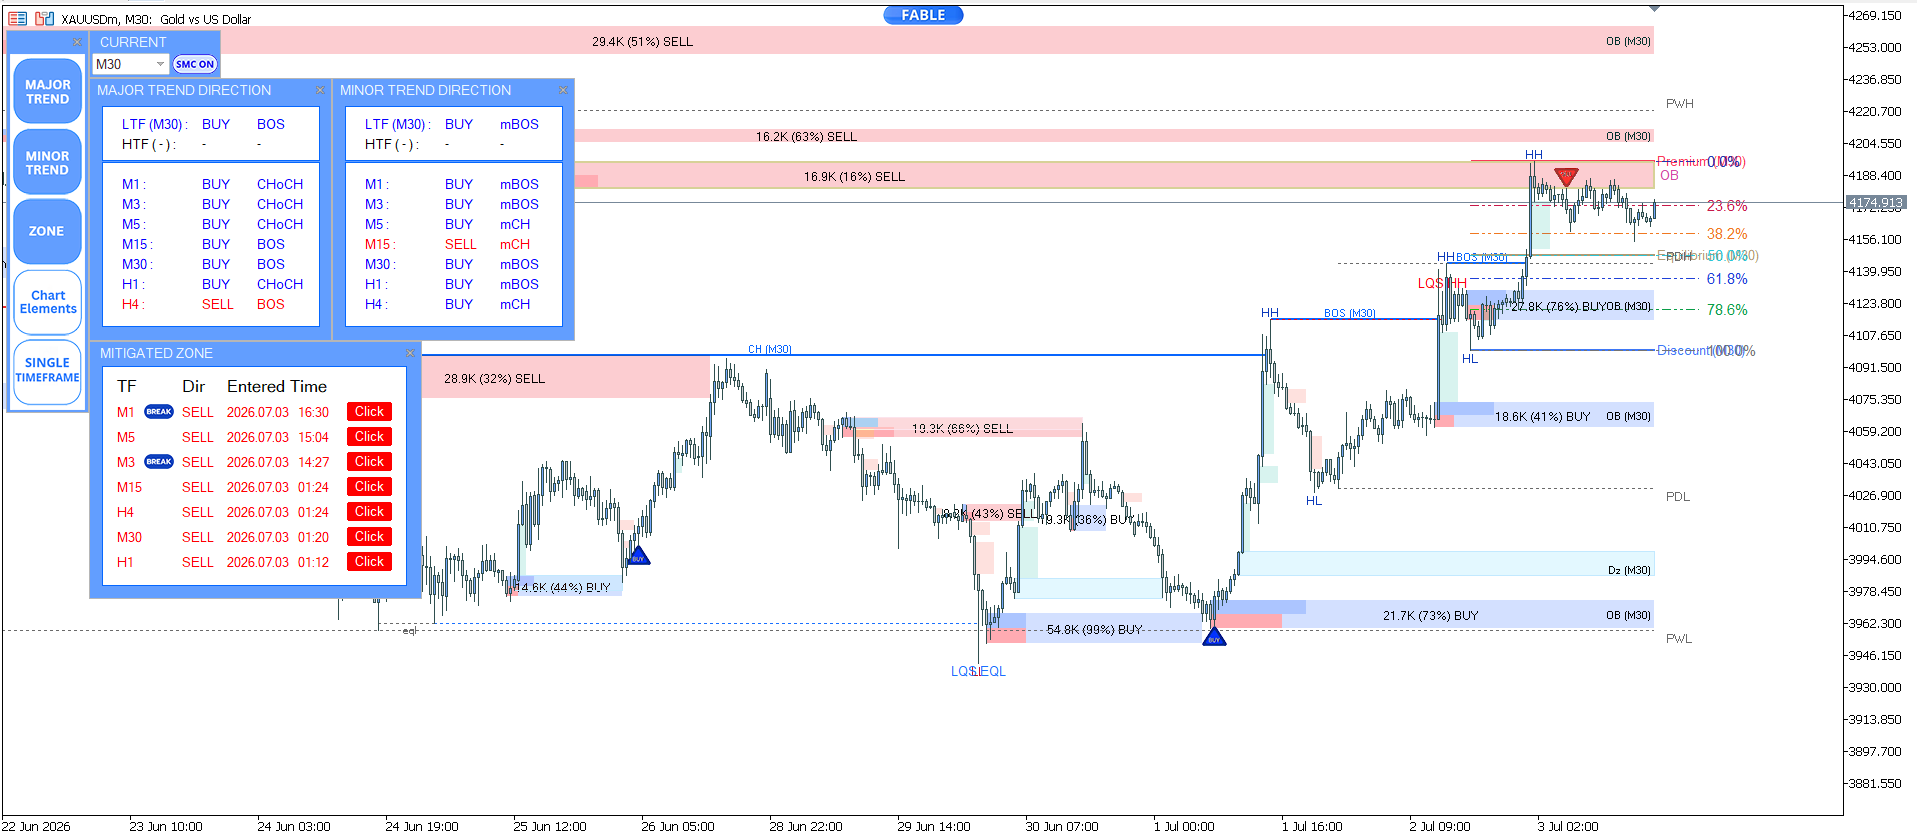
Available display options include:
1. Time Frame
- Selected Timeframe Dashboard — choose the timeframe you want displayed on the dashboard
2. Chart
- SMC Market Structure (Major Trend / Minor Trend)
- Premium & Discount Zones
- Auto Fibonacci
- Order Blocks (OB) / Volumized Order Blocks (VOB)
- Supply & Demand Zones
- Fair Value Gaps (FVG)
- Equal Highs & Equal Lows
- Previous Day & Previous Week Levels
- Liquidity Sweeps (LQS)
- Trading Sessions
3. Signal Switch / Trend Following
- BUY / SELL Signals
Details of dashboard settings and chart elements
1. Time Frame
Choose the timeframe you want displayed on the dashboard, setting the timeframe you plan to use according to your analysis plan. The system supports alerts when price enters a key zone based on the relevant settings.
2. Chart Settings
You can turn each chart element on or off to adjust the display to suit your analysis style.
2.1 Unmitigated (Unused Zones)
- Enabled: Shows only zones that have not yet been tested or used (Unmitigated Zones)
- Disabled: Shows both zones that have been tested and zones that have not been tested
2.2 SMC Market Structure
Used to turn SMC market structure display on or off, with options as desired:
- Major: Shows only the Major Trend market structure
- Minor: Shows only the Minor Trend (short-term trend within the main trend) market structure
2.3 Premium / Discount
Used to turn the Premium and Discount zone display on or off, to help assess the price's position within the structural range used for the system's analysis
- Uptrend: Consider buying opportunities when price is in the Discount Zone, using other confirming factors as well
- Downtrend: Consider selling opportunities when price is in the Premium Zone, using other confirming factors as well
2.4 Auto Fib Levels
Used to turn automatic Fibonacci level display on or off. The system calculates levels from the latest market structure and updates them when a new structure is confirmed, such as a BOS or CHoCH, according to the indicator's logic.
2.5 Order Blocks (OB) / Volumized Order Blocks (VOB)
Used to turn Order Blocks and Volumized Order Blocks display on or off on the chart
2.6 Supply and Demand (Sz / Dz)
Used to turn Supply Zones and Demand Zones display on or off
2.7 FVG (Fair Value Gap)
Used to turn Fair Value Gaps display on or off on the chart
2.8 EQH / EQL (Equal Highs / Equal Lows)
Used to turn Equal Highs and Equal Lows level display on or off — areas where price has made similar highs or lows multiple times, and which may be areas where market participants have placed Stop Loss orders
2.9 PDH / PDL / PWH / PWL
Used to turn the previous day's and previous week's highest and lowest price levels on or off
- PDH / PDL (Previous Day High / Low): The highest and lowest points of the previous day, which traders may use to help track liquidity and price reaction
- PWH / PWL (Previous Week High / Low): The highest and lowest points of the previous week, which may be important levels for tracking price movement and liquidity
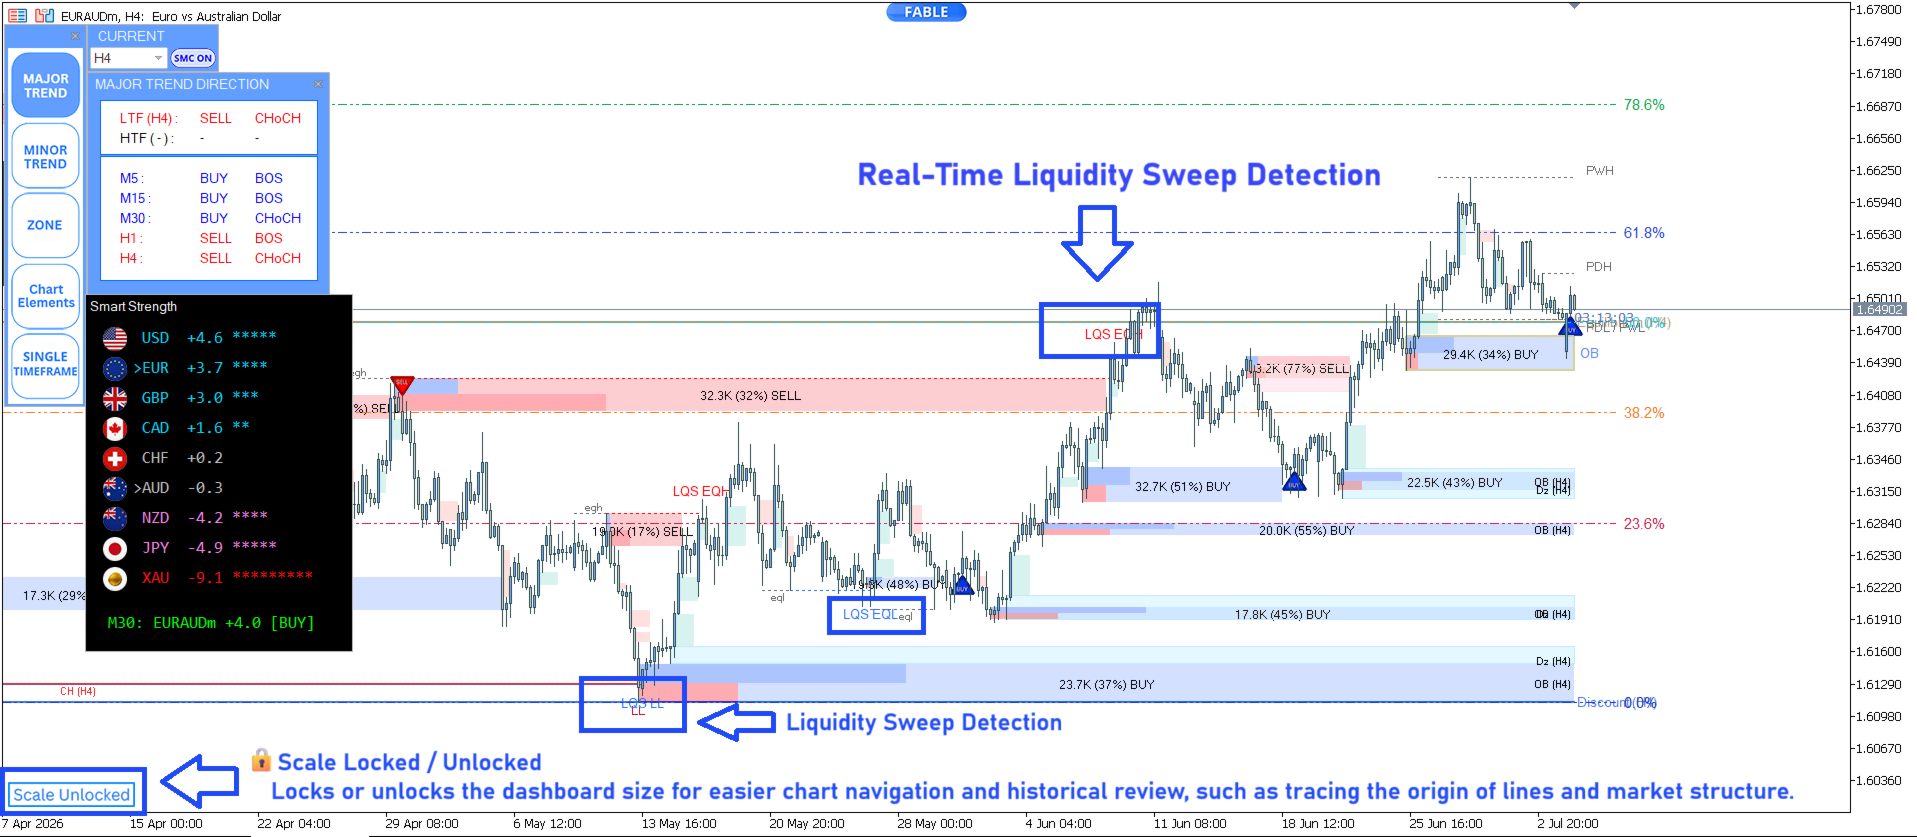
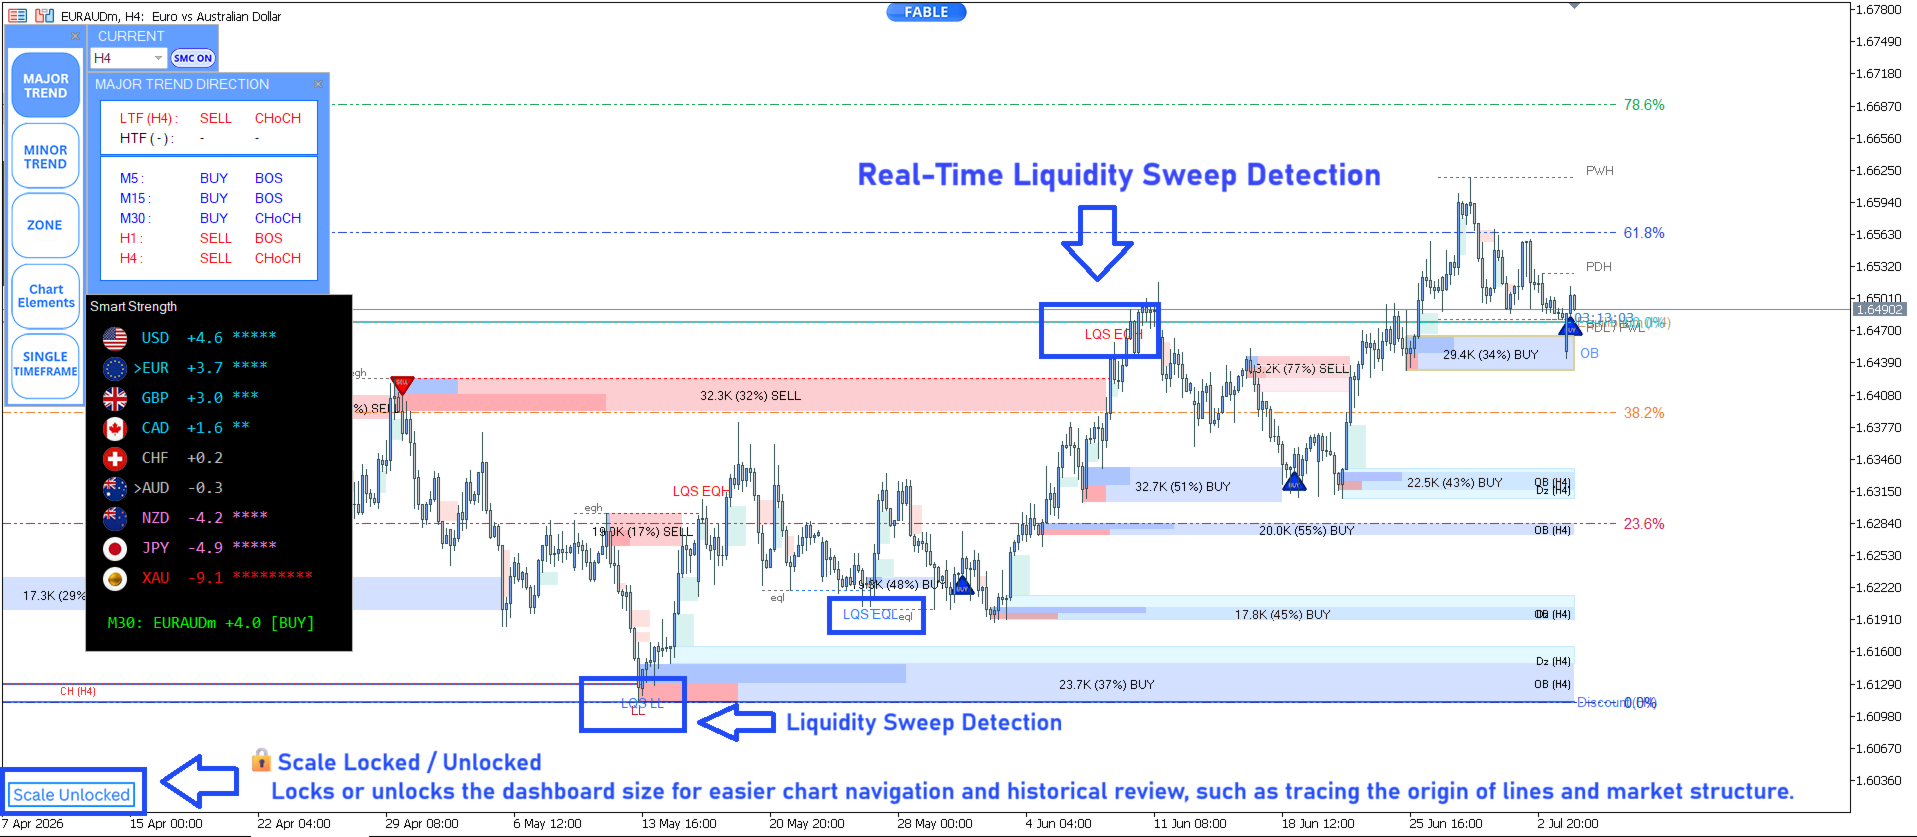
2.10 Liquidity Sweep (LQS)
Used to turn Liquidity Sweeps and related liquidity levels display on or off on the chart. The system can show elements that support the analysis, such as:
- Liquidity Sweeps: Price movement that breaks above or below a key level, which may be followed by a return to the previous price range
- Equal Highs / Equal Lows: Nearby high or low points
- PDH / PDL: The highest and lowest points of the previous day
- PWH / PWL: The highest and lowest points of the previous week
- Swing Highs / Swing Lows: Swing high and low points used to help read market structure and assess areas where price may react
2.11 Trading Sessions
Used to turn the display of the main trading sessions on or off, namely Tokyo, London, and New York. Each session may have different liquidity, volatility, and economic-activity characteristics, so traders may use this information to help plan and choose the period that suits their strategy.
Trading Sessions has 2 display formats:
- Above Candles: Shows the session name or bar above the candles
- Price Boxes: Shows a box corresponding to the session's price range
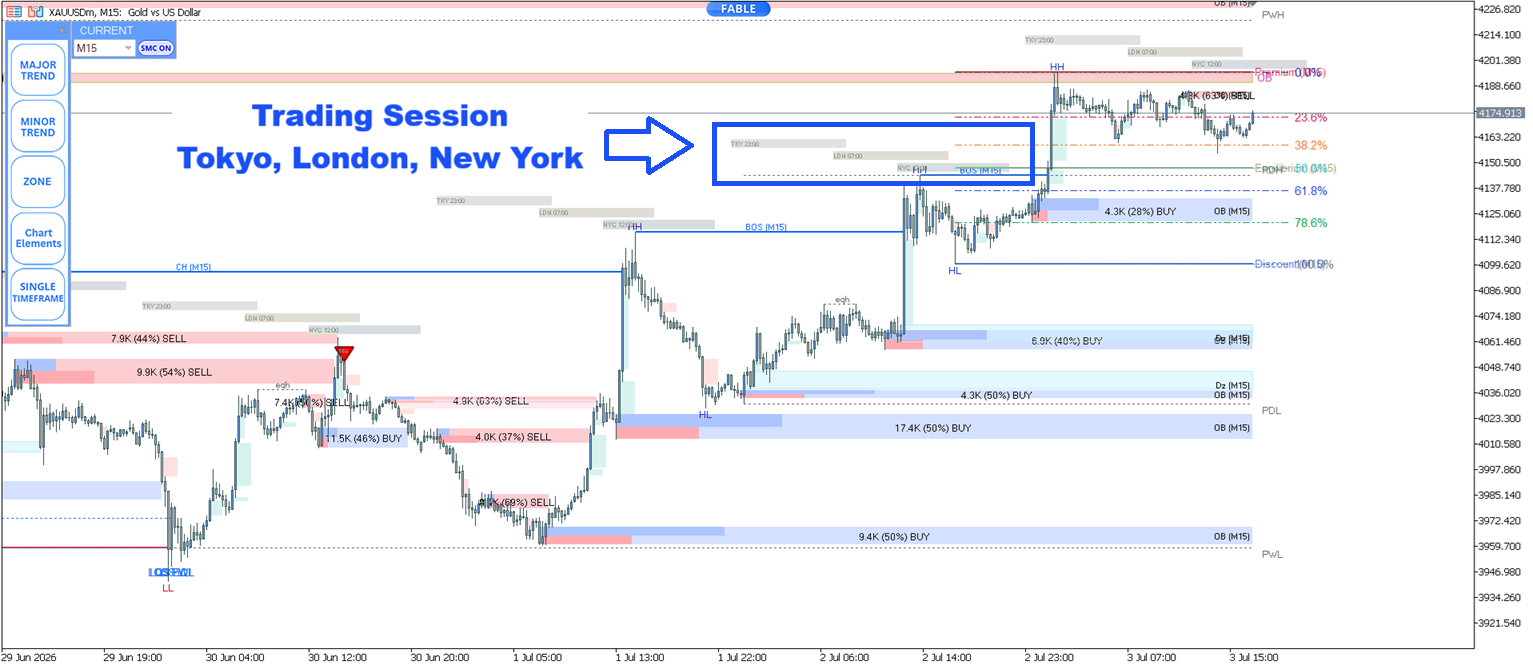
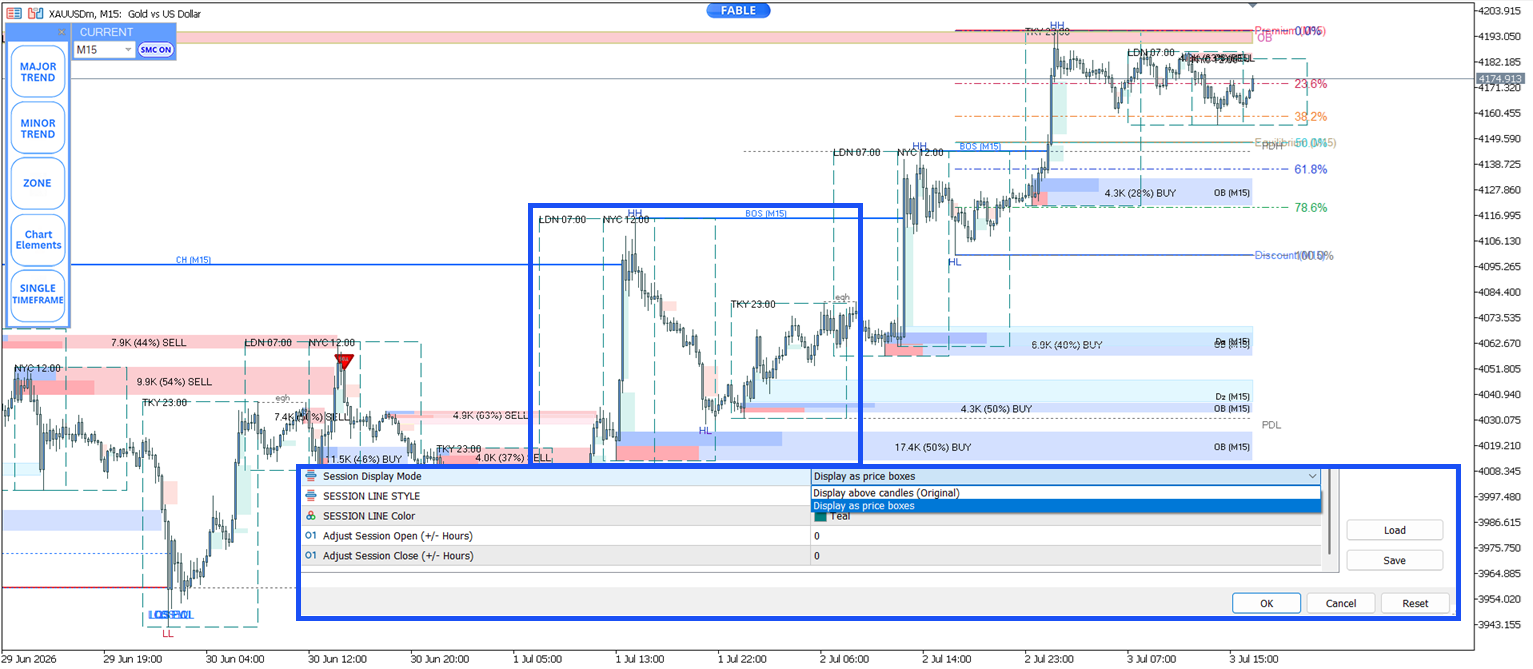
Left: Above Candles · Right: Price Boxes
3. Signal Switch / Trend Following
Signal Switch: Used to turn BUY / SELL signal display on or off on the chart
Trend Follow: Controls signal filtering according to market trend direction, referencing market structure based on the SMC system, to help users consider signals together with market direction. However, it should be used together with structure, zones, and risk management — signals alone should not be used to make decisions.
Single Timeframe vs Multi Timeframe: Which Mode Should You Choose
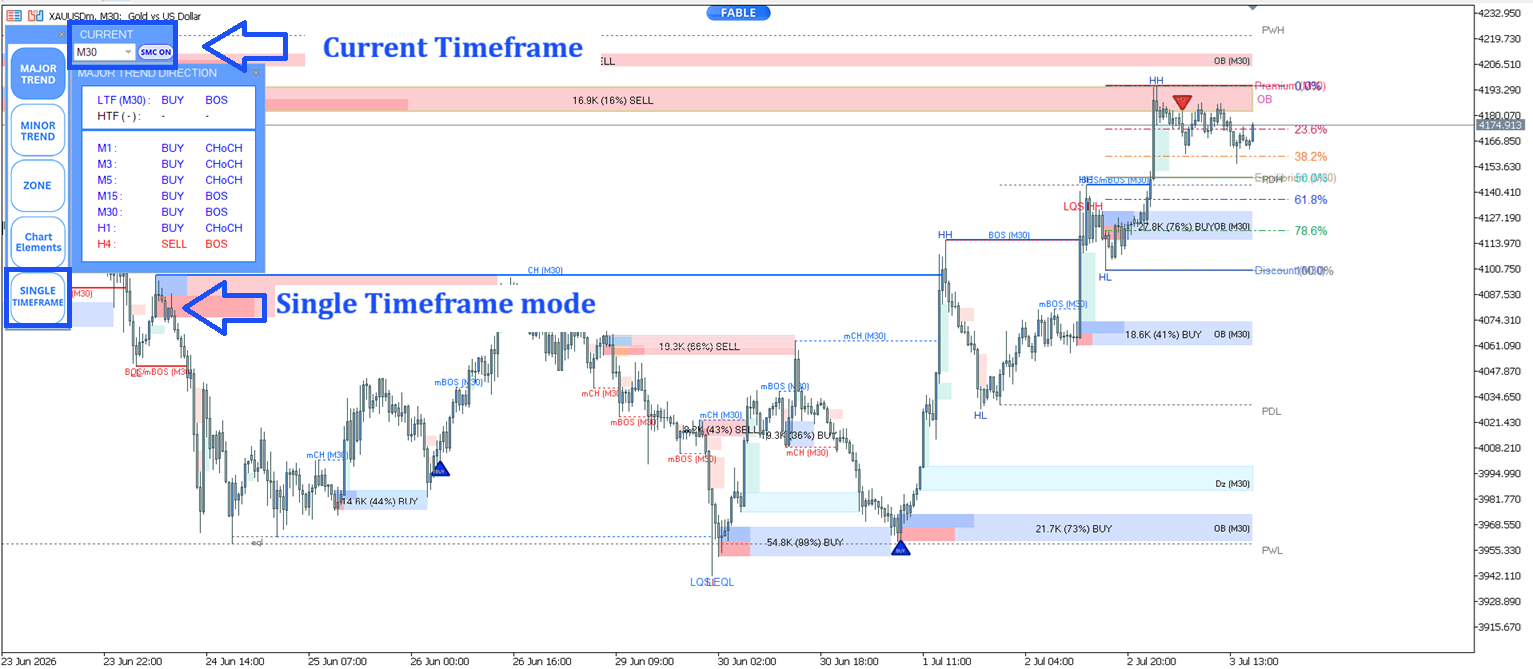
Single Timeframe Analysis
Analyze structure, zones, and all signals on a single open timeframe. Suitable for those who prefer simplicity and focusing on one timeframe.
Steps: Choose a timeframe that fits your style (e.g. H4/Daily for medium-long term, or M15/M5 for short term) → Analyze structure and POI within that timeframe → Determine entry/exit points, including SL/TP, all within the same timeframe
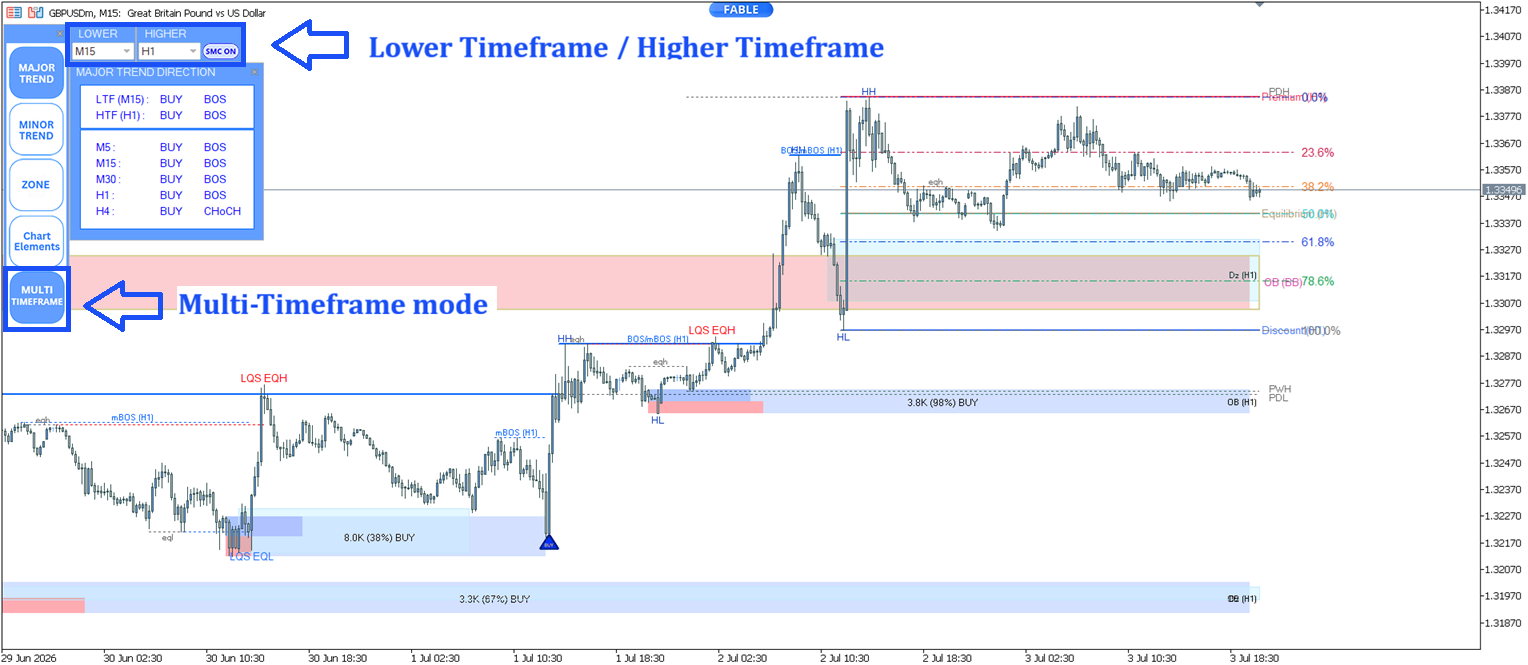
Multi Timeframe Analysis
More than just showing multiple timeframes on the dashboard — this is about projecting the structure and zones from a larger timeframe onto the chart of the timeframe currently in use. For example, setting H1 as the larger timeframe means all structure and zones are based on H1, while setting M15 as the smaller timeframe means trading signals are generated from M15.
Steps: Analyze the main trend from the larger timeframe (e.g. H4/Daily) → Find entry/exit points from the smaller timeframe (e.g. H1/M15) → Confirm that the smaller timeframe's signal aligns with the larger timeframe's trend before entering a trade
Real-Time Alerts and Push Notifications
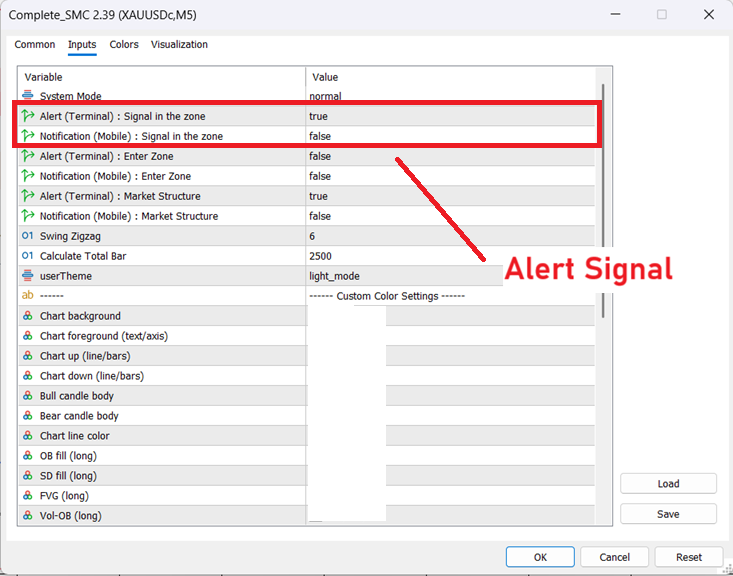
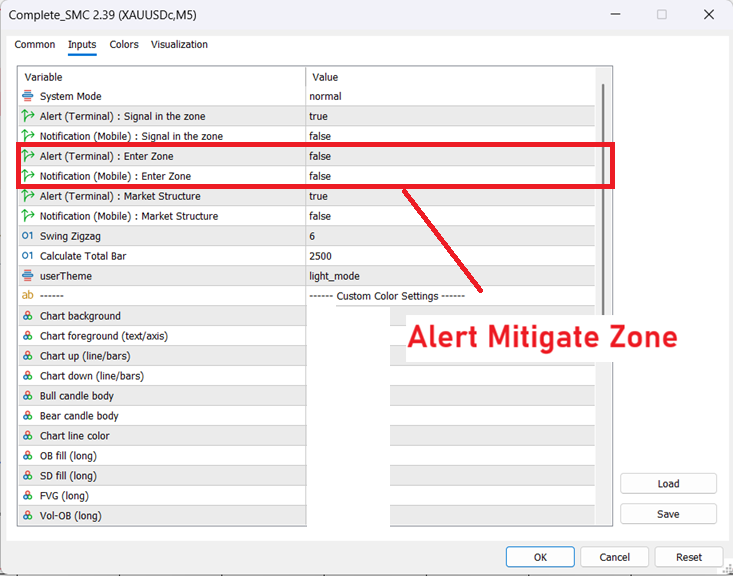
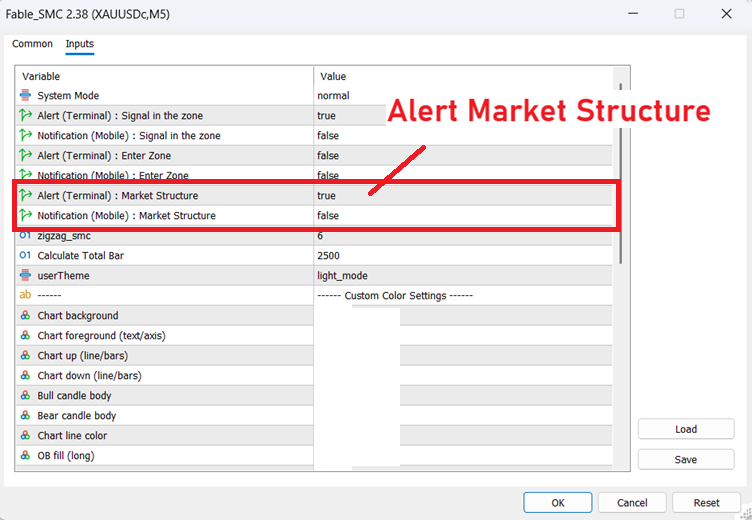
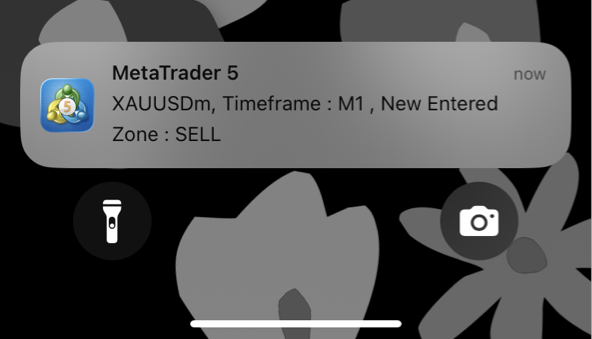
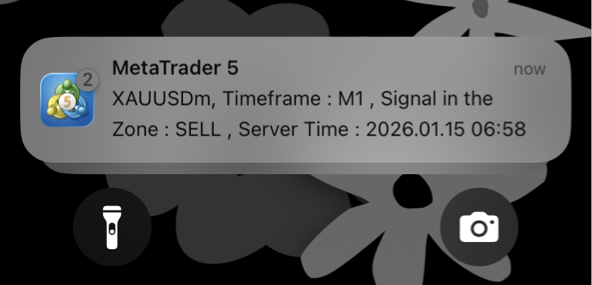
Supports instant alerts for Alert Signal, Alert Mitigation Zone, and market structure changes (BOS/CHoCH), sent directly to both MetaTrader 5 desktop and mobile via Push Notification.
Alert Signal
Alert Mitigation Zone
Market Structure Change (BOS/CHoCH)
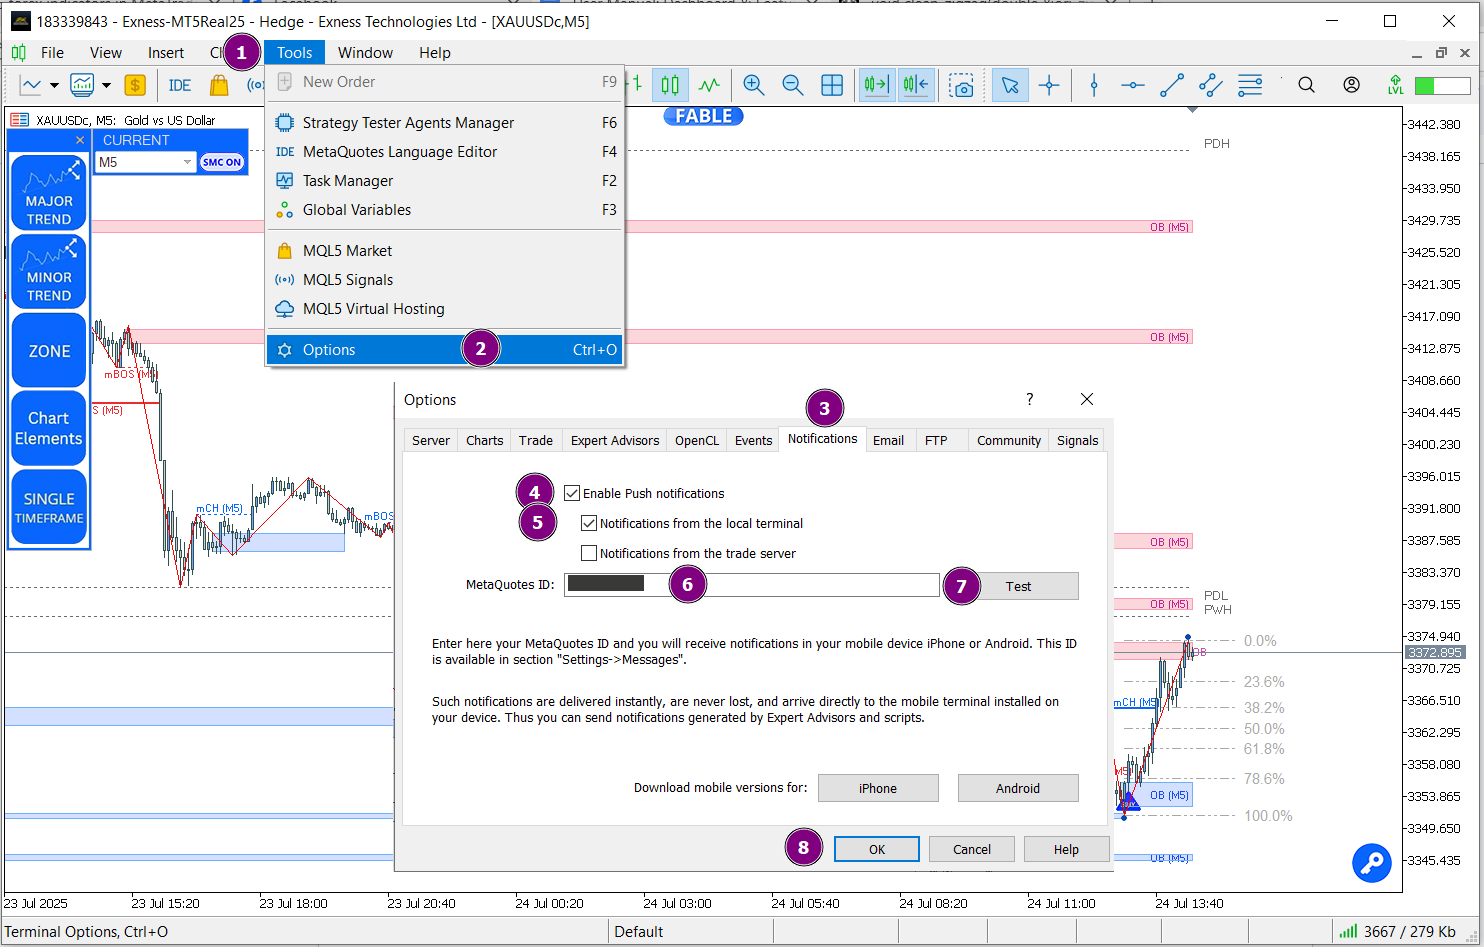
- 1Open MT5 on your computer, go to
Tools > Options > Notifications, enable Push Notifications, and enter your MetaQuotes ID - 2Open the MetaTrader 5 app on your phone, go to Settings, scroll to find your MetaQuotes ID, then copy and paste it into the field prepared on your PC
- 3Press Test to test it. If set up correctly, a test notification will be sent to your phone immediately
Customize the Display and Theme to Suit Your Style
Color Theme
Choose between Light Mode, Dark Mode, or customize every element yourself with Custom mode
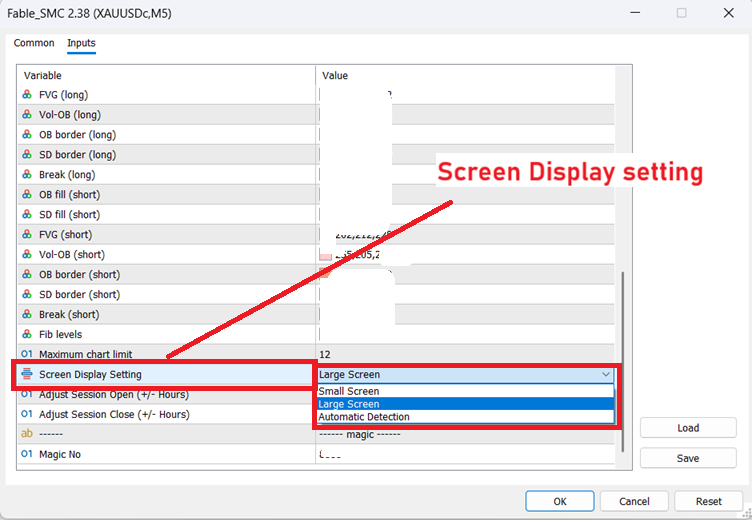
Automatic Screen Size Detection
Automatically adjusts the display to fit a small or large screen
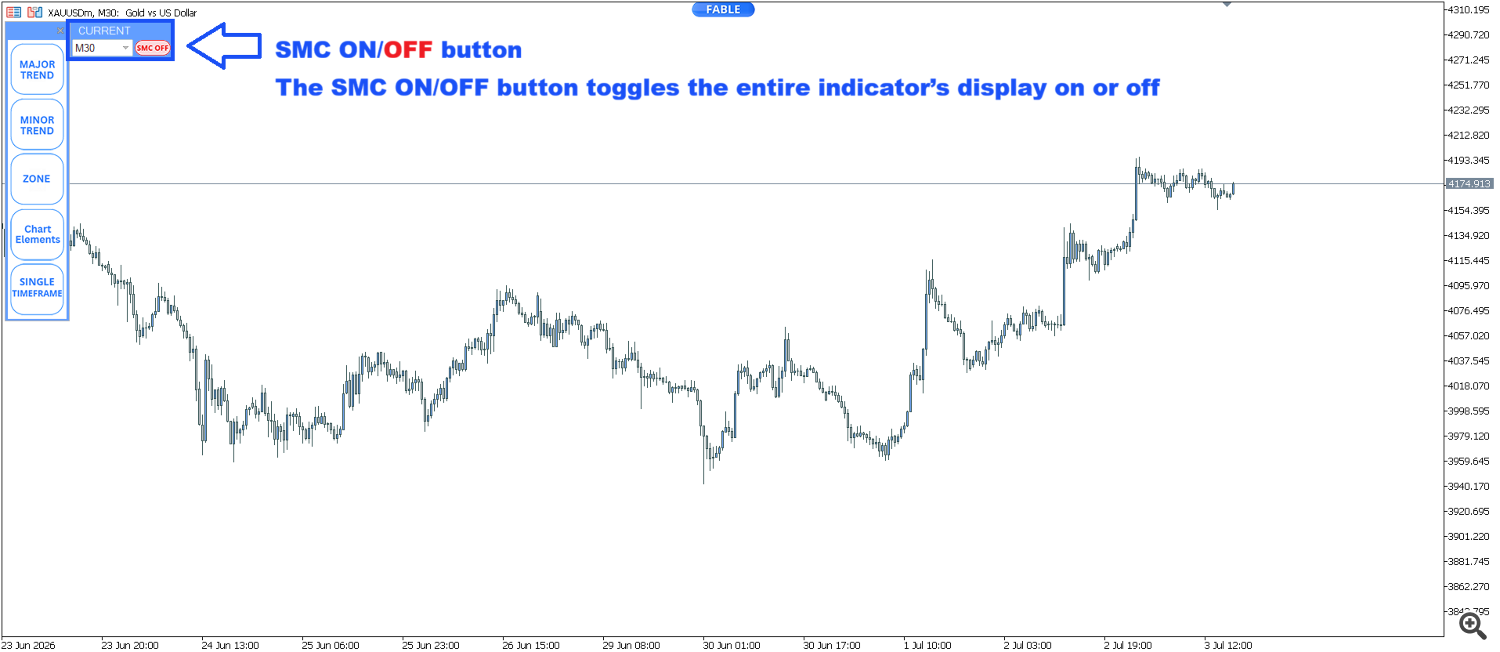
Show/Hide Control Panel
Click the FABLE logo to show or hide the entire control panel with a single click, including the SMC ON/OFF button to hide all SMC elements at once
Scale Locked/Unlocked
Lock or unlock the dashboard size, making it easier to explore historical charts and check the source of various lines
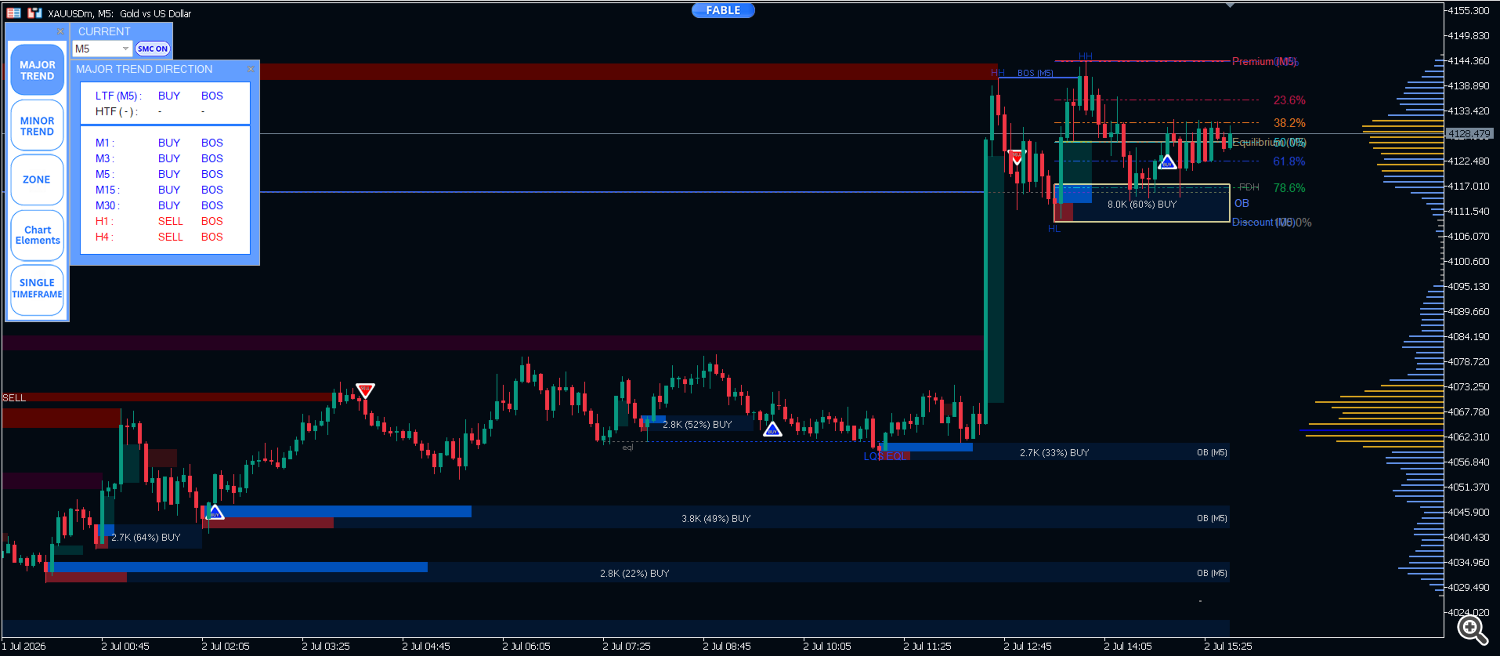
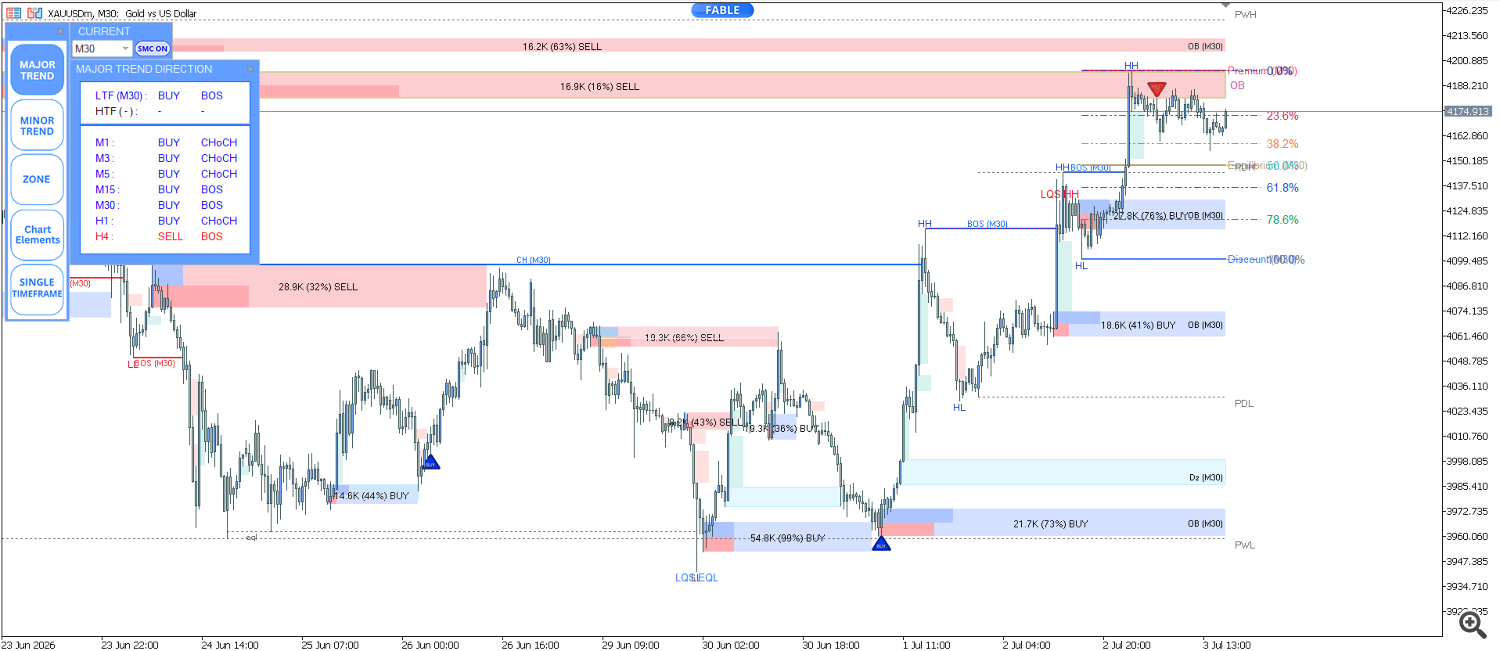
Left to right: Light Mode, Dark Mode, and a Custom theme where every element's color can be adjusted
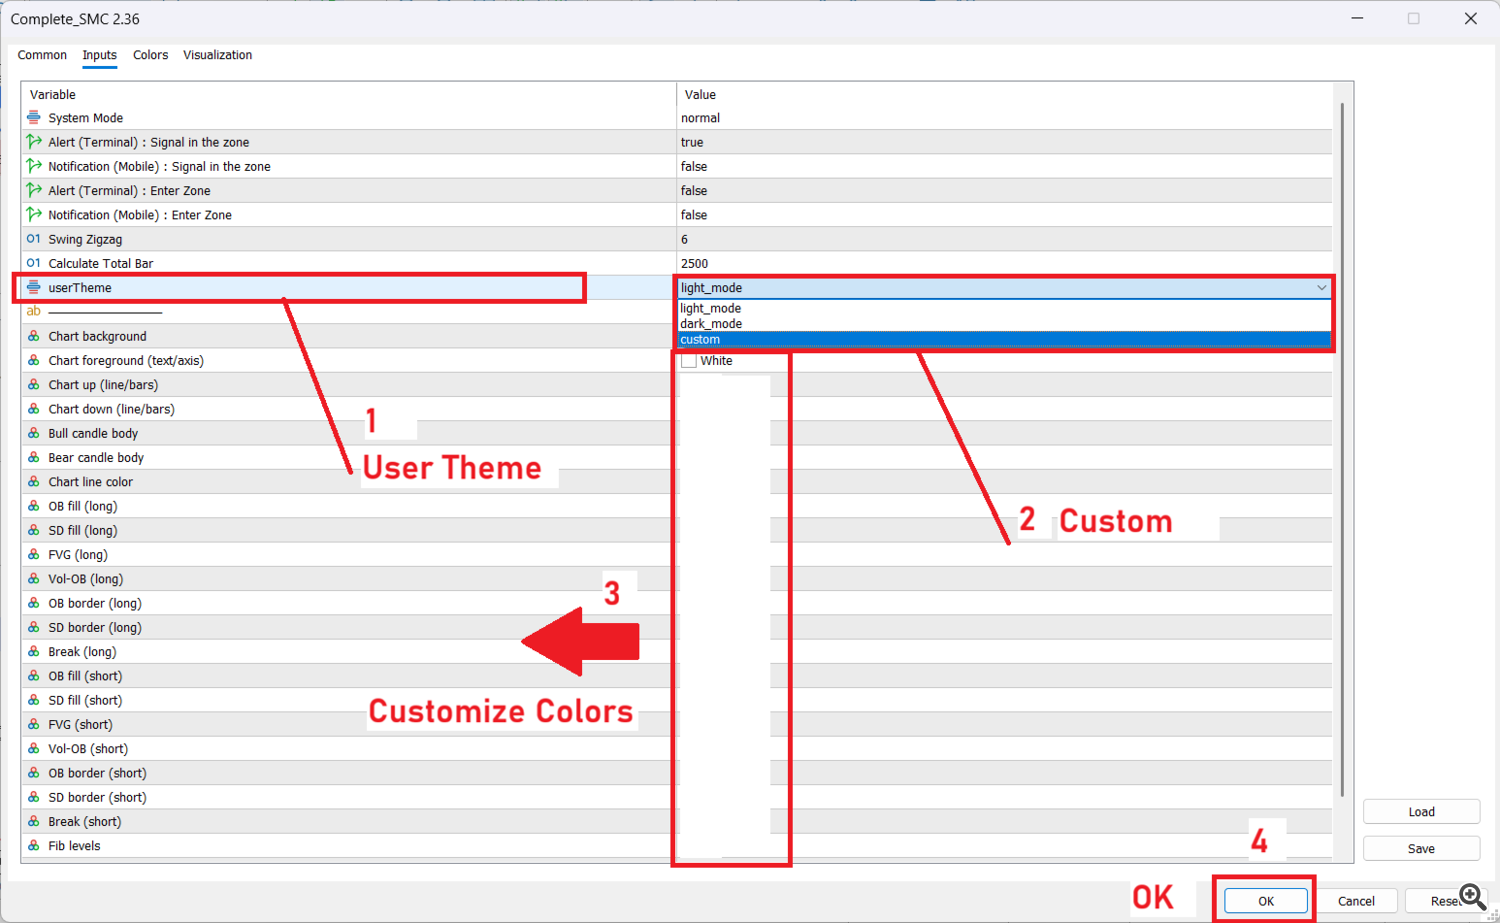
How to enable Custom color mode
Go to the Inputs menu, find the userTheme option, and change the value to Custom. You can then freely customize the colors of the chart background, candles, market structure, and various zones. Click each color box to choose your desired color, then press OK below to confirm and apply it immediately.
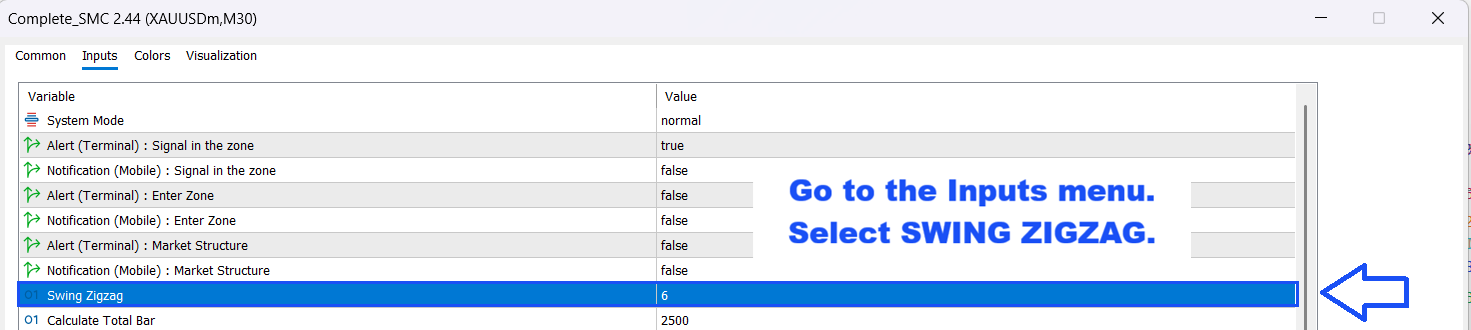
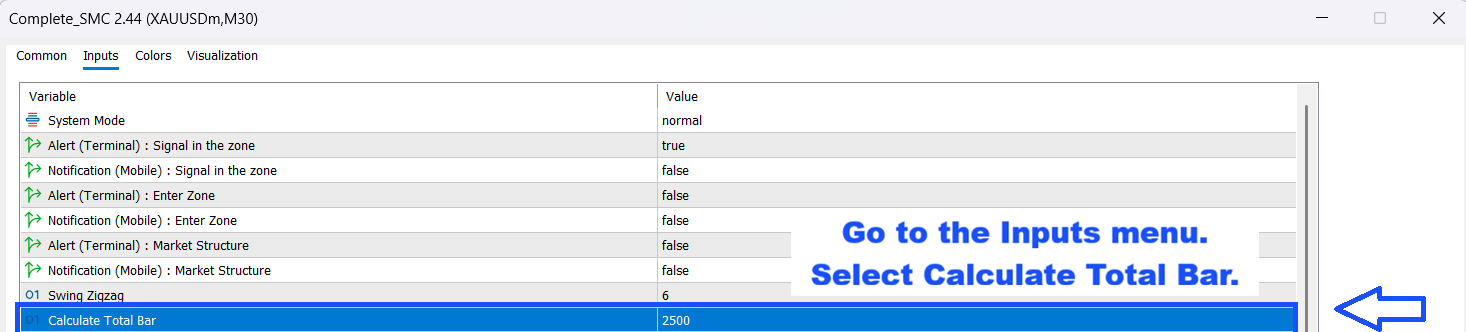
Swing ZigZag Settings
- 1Go to the Inputs menu
- 2Select SWING ZIGZAG or Calculate Total Bar
- 3Adjust the value as desired
- 4Press OK to apply it immediately
Choosing the Right Version: Indicator vs Utility
Both versions have exactly the same core SMC features. The only difference is that the Utility version comes with the Risk Per Trade tool built in.
Indicator Version
Recommended for those who use, or plan to use, other Trade Assistant tools alongside it in the future, since other Trade Assistant tools can be added to the same chart
Utility Version (Risk Per Trade)
Comes with the Risk Per Trade tool built in, but does not support using other Trade Assistant tools on the same chart. The advantage is ease of use, with everything in one tool.
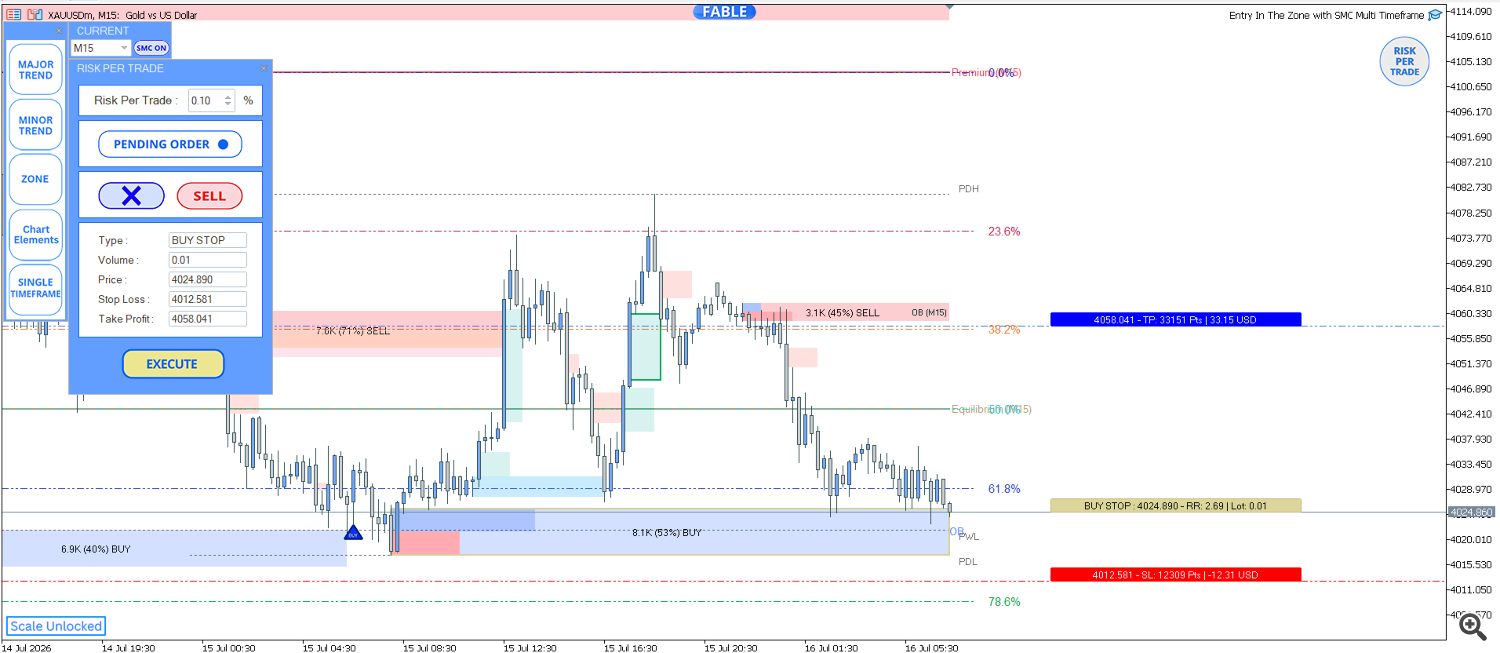
Risk Per Trade Calculator (Utility Version Only)
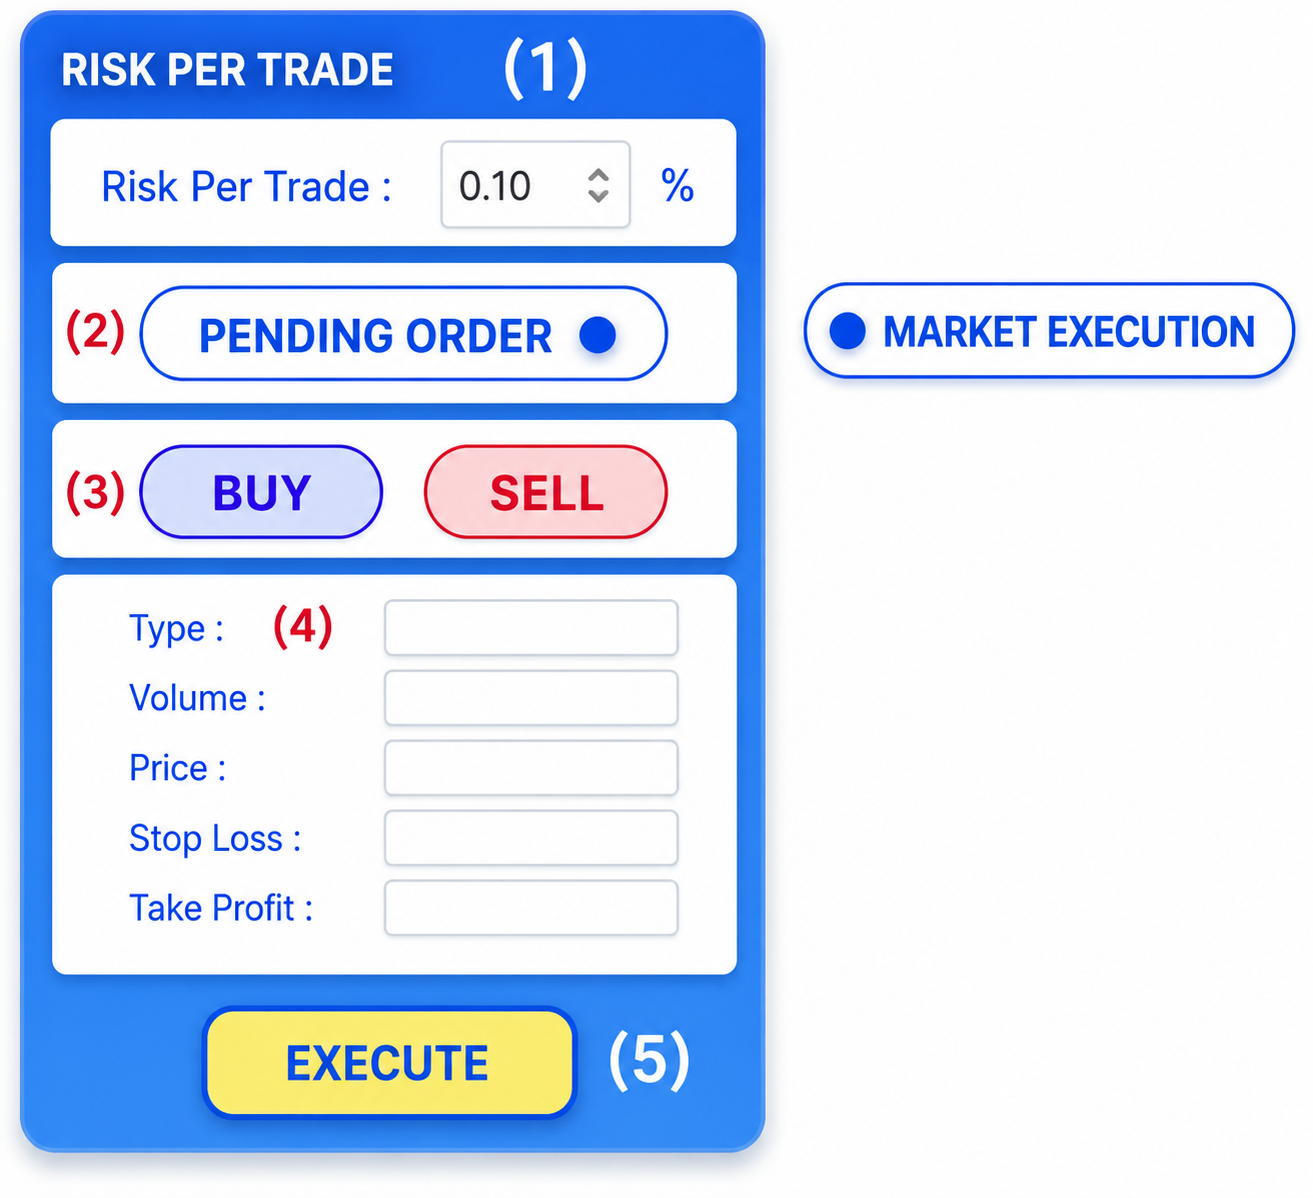
Calculating lot size incorrectly just once in a hurry can put you at more risk than you intended. This built-in risk calculator eliminates the manual calculation process entirely — just set your acceptable risk percentage and drag to your desired entry point, and the system will automatically calculate the rest, reducing both the time and the chance of errors from rushing or emotional decision-making.
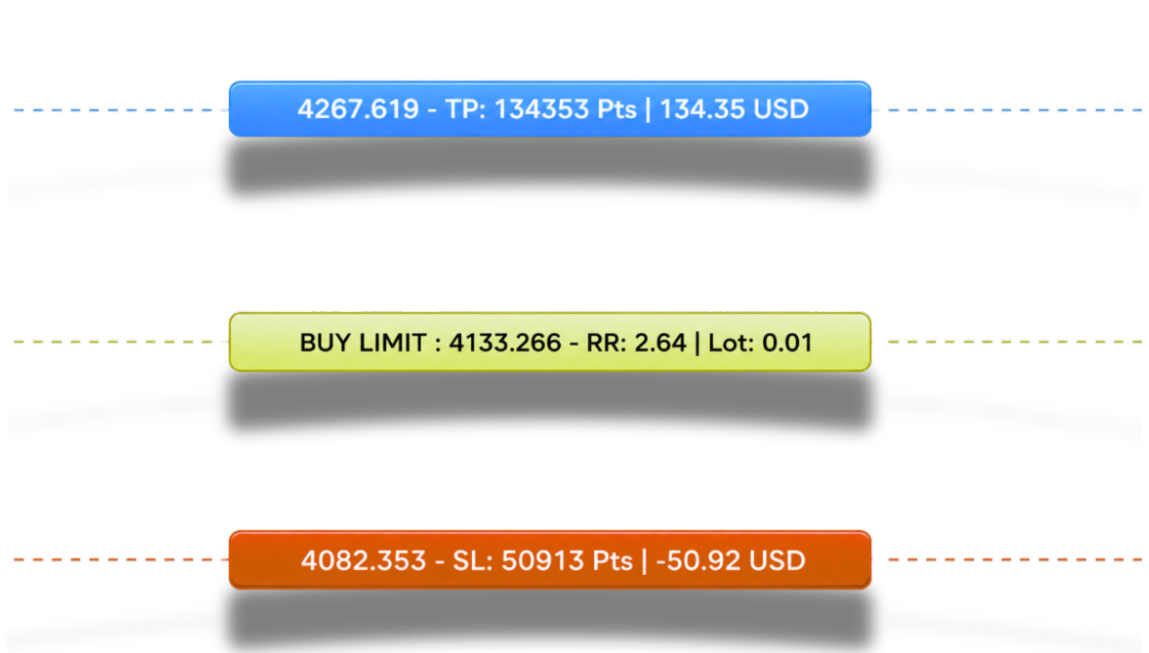
Gold box: Order entry point
Shows order type, price, Risk-Reward (RR) ratio, and lot size
Blue box: Take Profit
Shows price, number of points, and expected profit
Red box: Stop Loss
Shows price, number of points, and amount at risk
Installation and usage steps
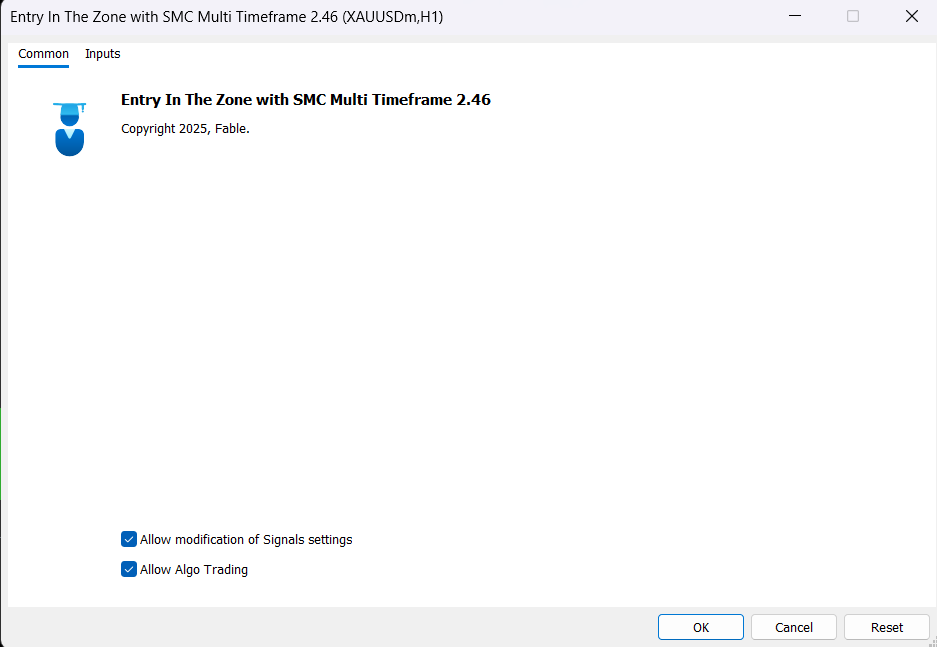
Make sure to enable these two options first: Allow modification of Signal settings and Allow Algo Trading. Then click the Algo Trading button to start using it.

The 5-Step Trading Workflow with Smart Money Concepts
Many people know SMC in theory, but when sitting in front of the screen, they don't know where to start — should they look at structure first or POI first? And how do you know when to wait and when to enter? Here is the SMC workflow broken down into 5 actionable steps, from reading the big picture to managing risk.
Identify Market Structure — the big picture tells direction, the small picture tells timing
Every SMC trade starts with one question: "What is the market doing right now?" Identify the main trend as an uptrend (continuous HH/HL), a downtrend (continuous LH/LL), or sideways. Watch CHoCH as a signal to get ready, not an immediate entry signal. Clearly define your timeframes: larger timeframes (H1/H4/D1) are used to read context and overall direction, while smaller timeframes (M15/M5/M1) are used to find precise entry timing. The simple rule is: never trade against the big picture, no matter how attractive the small picture looks.
Mark Key Points of Interest (POI) — set the trap in advance
Once direction is clear, the next step is to mark zones where large capital is likely to move. Identify Order Blocks, Supply/Demand zones, and FVG. Look for liquidity at EQH/EQL, PDH/PDL, and PWH/PWL — points where price is often drawn in before reversing. Use Premium/Discount zones together with Fibonacci levels (50/61.8/78.6) to assess whether the current price is in an "expensive" or "cheap" zone, and mark zones that haven't been tested yet (Unmitigated), since these carry more weight than zones the price has already passed through. This step is about "setting the trap in advance" and waiting for price to come to you.
Wait for Price and Assess Context — don't chase price, let price come to you
The most common mistake beginners make is entering too early, before the price reaches the planned zone. Wait for price to reach the POI marked in step 2. Watch for a liquidity sweep above/below EQH-EQL or PDH/PDL, PWH/PWL before a reversal occurs — a sign that Smart Money may be "sweeping liquidity" before entering a real position. Consider the current trading session (Tokyo, London, New York) and major news, since each session has different volatility and liquidity characteristics.
Confirm Entry (Smaller Timeframe) — clear signal, clear entry
Once price has reached the zone and the context aligns, this step is about confirming the signal on a smaller timeframe before actually entering a trade. If it's a reversal, look for CHoCH/mCHoCH indicating a change in structure. If it's a continuation, look for BOS/mBOS confirming the existing trend. A common pattern is: liquidity sweep → return into range → CHoCH/BOS near an OB/SD/FVG, confirming the position is in a Discount zone (for buying) or Premium zone (for selling).
Execute the Trade and Manage Risk — discipline, system
The final step is putting everything into practice together with clear risk-management rules. Enter a trade only after confirmation at the POI. Place Stop Loss below/above the zone or below/above the most recent swing point. Set Take Profit at the next OB/SD/FVG, or use market structure/Fibonacci to set multiple target levels. Maintain a Risk:Reward ratio of at least 1:2 (adjustable based on strategy), and consider using Partial Close or Trailing Stop to lock in profits.
The FABLE Pro Suite Toolkit
Purchase Entry In The Zone & SMC Multi Timeframe alone, and get a set of 7 tools that work together, free to use immediately, at no additional cost — and all of them continue to receive regular updates (see the actual update history in the table below).
| No. | Tool Name | Category | Latest Version | Last Updated |
|---|---|---|---|---|
| 1 | Auto Multi Trendlines – Breakout Signal Alerts | TREND | V 1.1 | Jun 11, 2026 |
| 2 | Price Action Radar | PRICE ACTION | V 1.2 | May 22, 2026 |
| 3 | Smart Strength | STRENGTH | V 1.6 | Jul 28, 2026 |
| 4 | Adaptive RSI Filter | MOMENTUM | V 1.0 | Nov 17, 2025 |
| 5 | Auto Volume Profile | VOLUME | V 2.6 | May 28, 2026 |
| 6 | Bar Count Down | TIMING | V 1.2 | Jul 18, 2026 |
| 7 | Adaptive Nadaraya MTF | TREND | V 1.75 | Mar 12, 2026 |
Usage details for each tool:
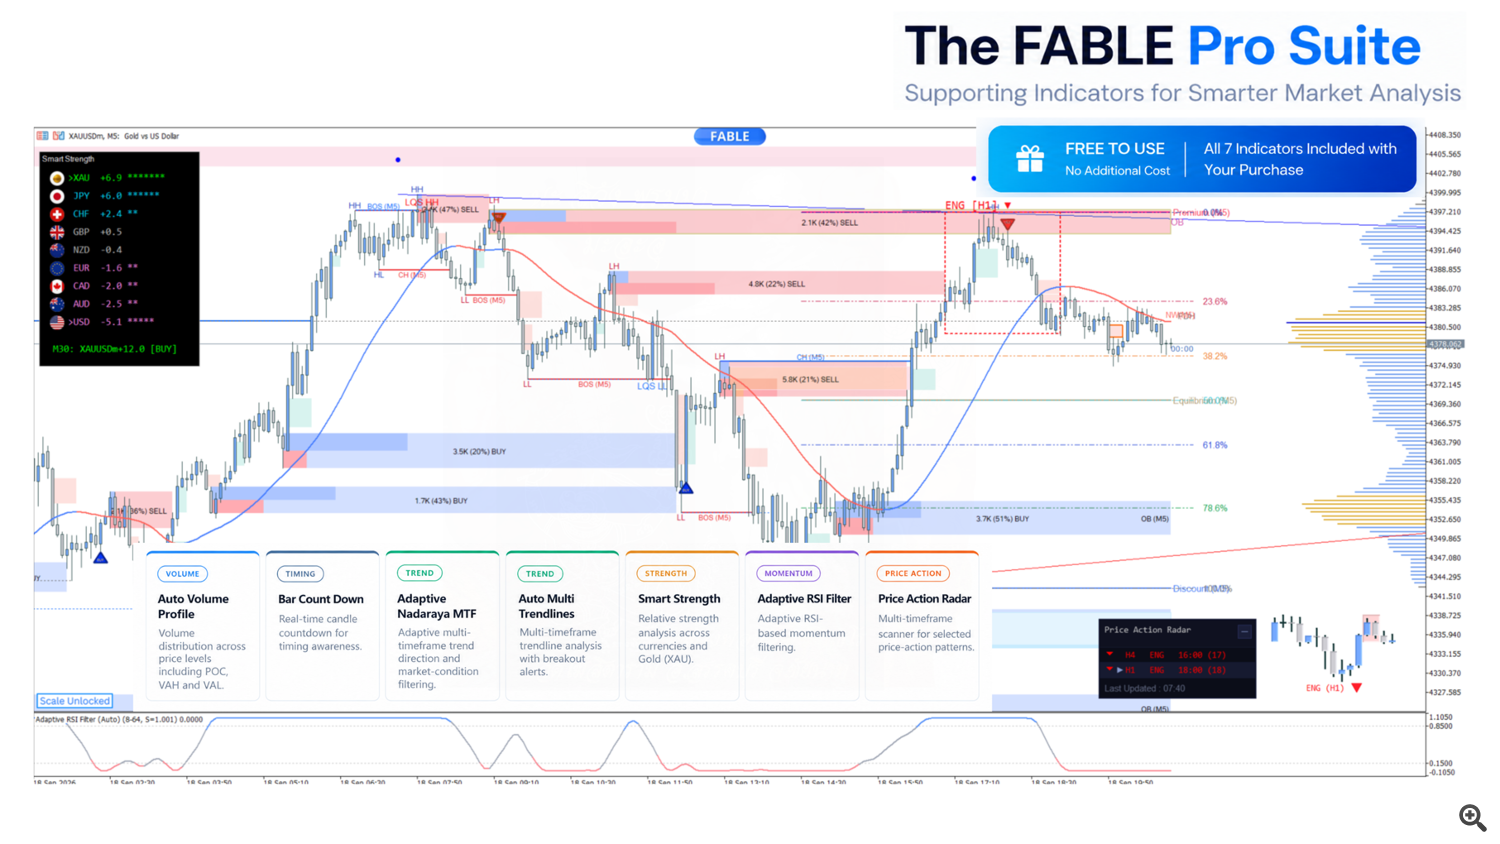
FABLE Pro Suite: all 7 bonus tools, free to use when you purchase Entry In The Zone & SMC Multi Timeframe
Click each tool's card below to download the .ex5 file directly
Multi Trendlines
Automatically draws trendlines from swing high-low points, covering up to 3 timeframes at once, with alerts when a Breakout occurs
Price Action Radar
Scans for price patterns across multiple timeframes in real time, detecting CRT, ENG, PIN, TTL, and TWZ, with a top-down view
Smart Strength
Measures real-time buying/selling pressure of currencies and assets across the whole market, including support for Gold (XAU)
Adaptive RSI Filter
A momentum filter that adjusts its sensitivity to market conditions, helping confirm entry timing without repainting
Auto Volume Profile
Shows the distribution of volume across price levels. You can adjust the display and VAH/VAL/POC lines from the Inputs menu.
Bar Count Down
Shows a real-time countdown before the current candle closes, on every enabled timeframe, letting you know in advance how much time remains before a new candle forms.
Directly useful for signal-based trading, since many signal types (such as BOS, CHoCH, or Price Action patterns) should only be trusted after a candle has fully closed. Bar Count Down helps prevent entering too early on a candle that hasn't closed yet, and helps you time your readiness before a new candle begins. Ideal for scalpers and news-time trading, which require precise timing.
Adaptive Nadaraya Multi-Timeframe
A non-repainting trend line that automatically adjusts sensitivity, making it easier to continuously track market direction
Purchase, Install, and Update
Steps from purchasing the product on the MetaTrader Market to updating to the latest version, including installation on multiple terminals.
1. How to purchase and install the indicator from the MetaTrader Market
- 1Log in to your own MQL5 account first. If you don't have one yet, sign up for a free MQL5 account before starting the next step.
- 2Click the green "Buy" button (a one-time payment of 89 USD) or the orange "Rent" button (59 USD per year), located on the left side of the product page
- 3The system will take you to the payment page, which supports several payment methods, such as credit/debit card, PayPal, WebMoney, or your MQL5 account balance (if any)
- 4Once payment is successful, the indicator will be added to the "Purchased Products" section of your MQL5 account, and can be downloaded immediately via MetaTrader 5 (menu Market > Purchased)
2. How to install on an MT5 terminal (first time or multiple machines)
- 1Open the MetaTrader terminal program
- 2Enter your MQL5.community account information (username) in the settings page. Go to the menu
Tools → Options → Community. - 3Go to
Navigator → Market → My Purchases - 4Click the "Install" button located on the right side of the product name
3. How to update to the latest version
- 1The terminal's product display window updates every 24 hours. If you don't yet see a new update, it means 24 hours haven't passed yet — wait for the next display cycle.
- 2Watch for the "Update" button. If a new version of the product is available, a notification message with an "Update" button will appear (or an "Update demo" button for the trial version of a paid product).
- 3Click "Update" to download the new version. The new file will automatically replace the old one. (Tip: if you want to keep the old version, save the original file under a different name, or move it outside the
[platform data folder]\MQL5\Market\folder before clicking update.) - 4If you want the new version to take effect immediately, remove the product from the Navigator window first, then restart the terminal, and reinstall it from the
Terminal → Market → Purchasedtab